 Back to Tasks
Task 25
Plug-in Electric Vehicles
Objective of Task
The topics of the task include vehicle energy consumption, component costs, vehicle costs, total cost of ownership (TCO), and market penetration.
Objectives associated with vehicle energy consumption are:
- Compare full-function HEVs, PHEVs, and ER-EVs to advanced conventional powertrains,
- Include a wide range of powertrain configurations,
- Evaluate the technology potential on both standard and real world driving cycles.
Objectives associated with Component Cost, Vehicle Cost and TCO are:
- Conduct a systematic cost methodology comparison,
- Examine whether a standard peak battery pack and electrical machine power level for both HEVs and PHEVs can be cost effective in spreading component costs across both HEV and PHEV platforms,
- Study powertrain depreciation attributes and impact on vehicle lifetime use costs.
Objectives associated with Market Penetration are:
- Conduct a systematic market penetration methodology comparison,
- Evaluate potential causes of increase in market(s) size, such as rising oil prices, lower battery pack costs, economical infrastructure adaption, changes of consumer perception,
- Evaluate policy alternatives to increase market(s) size,
- Taxes at initial purchase, annual fees, fuel/electricity tax,
- Subsidy structures and quantities.
working method
Vehicle Attributes
To evaluate the fuel efficiency benefits of advanced vehicles, each vehicle was simulated using Autonomie1. Each vehicle component powertrain is sized to meet similar vehicle technical specifications such as performance and grade-ability2. The energy efficiency was then estimated for the different vehicles over the Worldwide harmonized Light vehicles Test Cycle (WLTC) and the US combined cycle. Conventional and plug-in midsize vehicles were simulated through six different timeframes (2020–2050) for gasoline and diesel fuels. The attributes of future vehicles were taken from Moawad et al.2 We focused on four different powertrains (conventional; split PHEV [PHEV20]; EREV [PHEV40]; and Battery Electric Vehicles [BEV100, BEV200 and BEV300]). The split PHEV was modelled with one electric motor and a power-split design, and the EREV was modelled with two electric motors and a powertrain similar to the Voltec design3. Further details on the simulations can be found in Moawad et al2.
The above vehicles were simulated in Autonomie under the Worldwide harmonized Light vehicles Test Procedure (WLTP), U. S. Urban Dynamometer Driving Schedule (UDDS), and U. S. Highway Fuel Economy test (HWFET) drive cycles, using the same road load coefficients for all cycles. Adjustments were applied to the UDDS and HWEFT drive cycle fuel consumption values in accordance with the U. S. current fuel economy label procedures4.
To estimate the UF (the fraction of distance driven in CD mode), the daily driving distance was assumed to follow a gamma distribution, which was found to fit detailed driving records from Seattle by Lin et al5. A mean of 61.8 km/day and a mode of 20.6 km/day was assumed for U. S. drivers, based on an analysis of the U. S. 2009 National Household Travel Survey by Krumm6. This distribution gave a dependence of UF on the PHEV CD range that approximated the CD range dependence used in the standard practice recommended by SAE International for PHEVs that are charged once per day7. This distribution may not be accurate for other populations8, but it captures the qualitative shape of realistic driving distributions and provides a convenient way to approximate how PHEV UF depends on daily average driving distance9. The mean distance was varied to account for different annual driving distances, and the mode was assumed to vary in proportion to the mean. A constant value of 300 driving days per year was assumed. PHEV drivers were assumed to charge once per day.
We estimated the ownership costs under different assumptions to represent U. S. and German consumers. Combinations of the following parameters were evaluated that make PEVs cost-competitive with competing (conventionally powered) vehicles:
- The fuel and electricity consumption as estimated by WLTP and U. S. adjusted drive cycles;
- The future vehicle prices, estimated for year 2025;
- A range of potential future battery cost estimates;
- The fuel prices (reflecting ranges of possible prices in the U. S. and Germany);
- The annual driving distance (ranges representative of U. S. and German drivers).
Cost Calculations
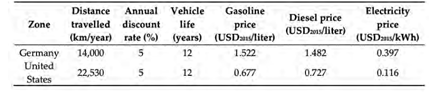
The vehicle costs are calculated from the characteristics of the components (power, energy, weight, etc.)2. Both the vehicle and fuel cost, based on the energy efficiency values, are then used to calculate ownership cost. Maintenance costs for year 2025 were assumed to be 0.05 USD2015/km for all powertrain types. This value was in the middle of the range suggested by Rousseau et al. The assumptions shown in Table 1 are used to represent the near-term (year 2025) average prices of energy in Europe (Germany) and the United States and were assumed to be constant in future years. Constant electricity prices were assumed, neglecting alternative rate structures such as time-of-use, tiered rates, or special rates for PEVs.
Energy prices and average annual distance driven in the United States were based on the U.S. Energy Information Agency’s Annual Energy Outlook (AEO) for 2017 reference case. Energy prices for Germany were estimated for the year 2025 based on the projected price of crude oil (Brent Spot price of 85.03 USD2015/barrel). High and low energy prices were based on AEO 2017 High Oil Price and Low Oil Price cases. Annual distance driven in new light duty vehicles (LDVs) by U. S. drivers were taken from AEO 2016 reference case. The mileage for German drivers is taken from the latest national transport survey.
Table 1 Energy cost assumptions for 2025
Cost models were used to estimate manufacturing costs for major vehicle components and subassemblies, which were then summed to give the total manufacturing cost of each vehicle in year 20252. These manufacturing cost estimates were assumed to be the same for both American and European automakers (Table 2). Cost model parameters were assigned values based on input from U. S. DOE vehicle technology managers and industry experts who provided a range of values from highly optimistic (high case) to pessimistic (low case).
Table 2 Estimated future manufacturing cost

The RCO was calculated from vehicle prices and other costs:
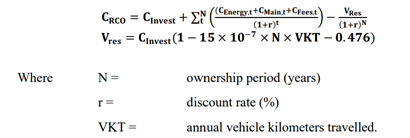
Investment costs include the vehicle manufacturing direct costs, manufacturer mark-up (accounted for by a retail price equivalent [RPE] factor), sales tax or value-added tax, both applied to the retail price, incentive (or bonus/malus premium/charge), and initial registration/licensing fees or taxes. For the BEV in the United States, the cost of home electric vehicle service equipment (EVSE) is also included in the investment cost. Given the capacity of BEVs, charging times using only a Level 1 charger do not meet the requirements of most consumers: a recent survey of California drivers found that only 12 % of Nissan Leaf owners did not have Level 2 EVSE at home12. Because of the higher voltage level (240 V) in Europe, EVSE costs are not considered for Germany.
Residual values after a service time of 10 years were calculated using regression equations developed by Pröpfe et al.13 for each powertrain type. These equations were developed from European vehicle sales data and may not accurately model resale values in the United States. Resale values are uncertain, particularly for PEVs, since the used PEV market is very immature. Residual values were estimated as a fraction of the total investment cost rather than purchase price, since the investment cost was assumed to approximate more closely the transaction cost as it includes incentives and fees, and since evidence suggests that incentives decrease residual values14. A residual value of zero was assumed after a service time of twelve years or a total distance travelled higher than 338,000 kilometres.
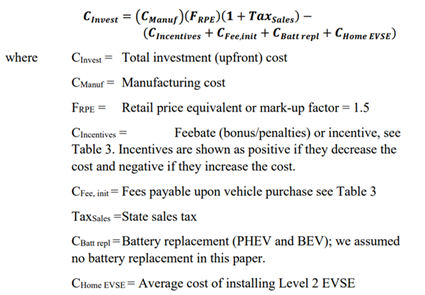
The incentives have a high impact on the RCO and are geographically dependent. In the United States, we considered only the federal subsidies (tax credits) for plug-ins, which depend on the battery total rated capacity in kWh as follows: 2,500 U. S. dollars (USD) for each PEV with at least 5 kWh total battery capacity, plus 417 USD for each kWh in excess of 5 kWh, up to a maximum of 7,500 USD. We treat these values as 2015 USD. In reality, the subsidy decreases for each automaker after the automaker sells more than 200,000 PEVs, which was neglected in this study. In Germany, the subsidies are 3,000 EUR for each PHEV and 4,000 EUR for each BEV15. Using a conversion factor of one EUR to 1.0598 USD results in 3,179 USD for each PHEV and 4,239 USD for each BEV. These values are also treated as 2015 USD.
We evaluated sensitivities to assumptions by examining ranges of fuel prices, battery costs, and annual distance travelled. From these results, we examined which factors are most important in the United States and Germany for cost of ownership of PHEVs and BEVs, and under what combination of conditions PHEVs and BEVs are cost-competitive with other drivetrains.
Results
EVs can be cost-competitive with other powertrains under favorable conditions. These include various combinations of high fuel prices, low battery costs, and high annual driving distances. Energy savings from PEVs, especially BEVs, are somewhat sensitive to the fuel and electricity consumption estimates. The differences in fuel costs between the WLTP and adjusted U. S. cycles indicate the importance of energy consumption values. These differences become more important under high fuel prices. When energy costs per kilometer for EVs and conventional vehicles differ widely (high gasoline price and low electricity price), annual distance travelled becomes an important factor and PEVs can be cost competitive at high annual VKT. When energy cost per kilometer is similar, purchase price differences are more important, and EV cost competitiveness is more sensitive to assumptions about battery costs. Since future fuel prices are uncertain, and driving distances differ between drivers, it is difficult to predict how competitive EVs will be, but it is important to consider the interactions of multiple factors. However, there are factors that we did not consider that influence BEV adoption, such as the difference between the acceleration performance of PEVs and conventional vehicles, the limited range of the BEV100 and BEV200, and also availability of public charging stations.
Objective of Task
The topics of the task include vehicle energy consumption, component costs, vehicle costs, total cost of ownership (TCO), and market penetration.
Objectives associated with vehicle energy consumption are:
- Compare full-function HEVs, PHEVs, and ER-EVs to advanced conventional powertrains,
- Include a wide range of powertrain configurations,
- Evaluate the technology potential on both standard and real world driving cycles.
Objectives associated with Component Cost, Vehicle Cost and TCO are:
- Conduct a systematic cost methodology comparison,
- Examine whether a standard peak battery pack and electrical machine power level for both HEVs and PHEVs can be cost effective in spreading component costs across both HEV and PHEV platforms,
- Study powertrain depreciation attributes and impact on vehicle lifetime use costs.
Objectives associated with Market Penetration are:
- Conduct a systematic market penetration methodology comparison,
- Evaluate potential causes of increase in market(s) size, such as rising oil prices, lower battery pack costs, economical infrastructure adaption, changes of consumer perception,
- Evaluate policy alternatives to increase market(s) size,
- Taxes at initial purchase, annual fees, fuel/electricity tax,
- Subsidy structures and quantities.
working method
Vehicle Attributes
To evaluate the fuel efficiency benefits of advanced vehicles, each vehicle was simulated using Autonomie1. Each vehicle component powertrain is sized to meet similar vehicle technical specifications such as performance and grade-ability2. The energy efficiency was then estimated for the different vehicles over the Worldwide harmonized Light vehicles Test Cycle (WLTC) and the US combined cycle. Conventional and plug-in midsize vehicles were simulated through six different timeframes (2020–2050) for gasoline and diesel fuels. The attributes of future vehicles were taken from Moawad et al.2 We focused on four different powertrains (conventional; split PHEV [PHEV20]; EREV [PHEV40]; and Battery Electric Vehicles [BEV100, BEV200 and BEV300]). The split PHEV was modelled with one electric motor and a power-split design, and the EREV was modelled with two electric motors and a powertrain similar to the Voltec design3. Further details on the simulations can be found in Moawad et al2.
The above vehicles were simulated in Autonomie under the Worldwide harmonized Light vehicles Test Procedure (WLTP), U. S. Urban Dynamometer Driving Schedule (UDDS), and U. S. Highway Fuel Economy test (HWFET) drive cycles, using the same road load coefficients for all cycles. Adjustments were applied to the UDDS and HWEFT drive cycle fuel consumption values in accordance with the U. S. current fuel economy label procedures4.
To estimate the UF (the fraction of distance driven in CD mode), the daily driving distance was assumed to follow a gamma distribution, which was found to fit detailed driving records from Seattle by Lin et al5. A mean of 61.8 km/day and a mode of 20.6 km/day was assumed for U. S. drivers, based on an analysis of the U. S. 2009 National Household Travel Survey by Krumm6. This distribution gave a dependence of UF on the PHEV CD range that approximated the CD range dependence used in the standard practice recommended by SAE International for PHEVs that are charged once per day7. This distribution may not be accurate for other populations8, but it captures the qualitative shape of realistic driving distributions and provides a convenient way to approximate how PHEV UF depends on daily average driving distance9. The mean distance was varied to account for different annual driving distances, and the mode was assumed to vary in proportion to the mean. A constant value of 300 driving days per year was assumed. PHEV drivers were assumed to charge once per day.
We estimated the ownership costs under different assumptions to represent U. S. and German consumers. Combinations of the following parameters were evaluated that make PEVs cost-competitive with competing (conventionally powered) vehicles:
- The fuel and electricity consumption as estimated by WLTP and U. S. adjusted drive cycles;
- The future vehicle prices, estimated for year 2025;
- A range of potential future battery cost estimates;
- The fuel prices (reflecting ranges of possible prices in the U. S. and Germany);
- The annual driving distance (ranges representative of U. S. and German drivers).
Cost Calculations
The vehicle costs are calculated from the characteristics of the components (power, energy, weight, etc.)2. Both the vehicle and fuel cost, based on the energy efficiency values, are then used to calculate ownership cost. Maintenance costs for year 2025 were assumed to be 0.05 USD2015/km for all powertrain types. This value was in the middle of the range suggested by Rousseau et al. The assumptions shown in Table 1 are used to represent the near-term (year 2025) average prices of energy in Europe (Germany) and the United States and were assumed to be constant in future years. Constant electricity prices were assumed, neglecting alternative rate structures such as time-of-use, tiered rates, or special rates for PEVs.
Energy prices and average annual distance driven in the United States were based on the U.S. Energy Information Agency’s Annual Energy Outlook (AEO) for 2017 reference case. Energy prices for Germany were estimated for the year 2025 based on the projected price of crude oil (Brent Spot price of 85.03 USD2015/barrel). High and low energy prices were based on AEO 2017 High Oil Price and Low Oil Price cases. Annual distance driven in new light duty vehicles (LDVs) by U. S. drivers were taken from AEO 2016 reference case. The mileage for German drivers is taken from the latest national transport survey.
Table 1 Energy cost assumptions for 2025
Cost models were used to estimate manufacturing costs for major vehicle components and subassemblies, which were then summed to give the total manufacturing cost of each vehicle in year 20252. These manufacturing cost estimates were assumed to be the same for both American and European automakers (Table 2). Cost model parameters were assigned values based on input from U. S. DOE vehicle technology managers and industry experts who provided a range of values from highly optimistic (high case) to pessimistic (low case).
Table 2 Estimated future manufacturing cost
The RCO was calculated from vehicle prices and other costs:
Investment costs include the vehicle manufacturing direct costs, manufacturer mark-up (accounted for by a retail price equivalent [RPE] factor), sales tax or value-added tax, both applied to the retail price, incentive (or bonus/malus premium/charge), and initial registration/licensing fees or taxes. For the BEV in the United States, the cost of home electric vehicle service equipment (EVSE) is also included in the investment cost. Given the capacity of BEVs, charging times using only a Level 1 charger do not meet the requirements of most consumers: a recent survey of California drivers found that only 12 % of Nissan Leaf owners did not have Level 2 EVSE at home12. Because of the higher voltage level (240 V) in Europe, EVSE costs are not considered for Germany.
Residual values after a service time of 10 years were calculated using regression equations developed by Pröpfe et al.13 for each powertrain type. These equations were developed from European vehicle sales data and may not accurately model resale values in the United States. Resale values are uncertain, particularly for PEVs, since the used PEV market is very immature. Residual values were estimated as a fraction of the total investment cost rather than purchase price, since the investment cost was assumed to approximate more closely the transaction cost as it includes incentives and fees, and since evidence suggests that incentives decrease residual values14. A residual value of zero was assumed after a service time of twelve years or a total distance travelled higher than 338,000 kilometres.
The incentives have a high impact on the RCO and are geographically dependent. In the United States, we considered only the federal subsidies (tax credits) for plug-ins, which depend on the battery total rated capacity in kWh as follows: 2,500 U. S. dollars (USD) for each PEV with at least 5 kWh total battery capacity, plus 417 USD for each kWh in excess of 5 kWh, up to a maximum of 7,500 USD. We treat these values as 2015 USD. In reality, the subsidy decreases for each automaker after the automaker sells more than 200,000 PEVs, which was neglected in this study. In Germany, the subsidies are 3,000 EUR for each PHEV and 4,000 EUR for each BEV15. Using a conversion factor of one EUR to 1.0598 USD results in 3,179 USD for each PHEV and 4,239 USD for each BEV. These values are also treated as 2015 USD.
We evaluated sensitivities to assumptions by examining ranges of fuel prices, battery costs, and annual distance travelled. From these results, we examined which factors are most important in the United States and Germany for cost of ownership of PHEVs and BEVs, and under what combination of conditions PHEVs and BEVs are cost-competitive with other drivetrains.
Results
EVs can be cost-competitive with other powertrains under favorable conditions. These include various combinations of high fuel prices, low battery costs, and high annual driving distances. Energy savings from PEVs, especially BEVs, are somewhat sensitive to the fuel and electricity consumption estimates. The differences in fuel costs between the WLTP and adjusted U. S. cycles indicate the importance of energy consumption values. These differences become more important under high fuel prices. When energy costs per kilometer for EVs and conventional vehicles differ widely (high gasoline price and low electricity price), annual distance travelled becomes an important factor and PEVs can be cost competitive at high annual VKT. When energy cost per kilometer is similar, purchase price differences are more important, and EV cost competitiveness is more sensitive to assumptions about battery costs. Since future fuel prices are uncertain, and driving distances differ between drivers, it is difficult to predict how competitive EVs will be, but it is important to consider the interactions of multiple factors. However, there are factors that we did not consider that influence BEV adoption, such as the difference between the acceleration performance of PEVs and conventional vehicles, the limited range of the BEV100 and BEV200, and also availability of public charging stations.